
Netflix USERBASE
DATA ANALYSIS
SQL & TABLEAU
This project seeks to uncover trends and insights within a streaming media company to aid in business decision-making.I focused on the metrics that interested me the most: subscription type, monthly revenue, age, country, and device type. I aim to uncover insights that will optimize revenue, marketing campaigns, and user experience.The dataset “Netflix Userbase.csv” is downloaded from Kaggle.
Questions to answer
Which plans are the most popular among different age groups?
Determine the most popular devices used for streaming.
Which devices are the most popular among different age groups?
Which subscription tiers are the most profitable?
Which markets are generating the most revenue?
hypothesis
Premium subscription plans are most popular for mature adults, whereas basic plan is most popular for young adults.
Users who access Netflix primarily through desktops (Smart TVs & laptops) generate more revenue than users who access via mobile (smartphone or tablet) devices.
Smart TVs are most popular for mature adults, whereas smartphones are most popular for young adults.
Users with premium subscriptions generate higher monthly revenue than those with base or standard.
The United States and Canada generate the most revenue.
Click on Github icon:
data analysis

The age range for this dataset is from 26 to 51. I grouped the users into 3 different age brackets. Users 34 and under are "Young Adults". Users between 35 and 42 are "Mid Adults". Users 43 and above are "Mature Adults".Q1: I predicted that mature adults would have a larger budget to purchase the premium plan. However, the premium plan is actually most popular among young adults, while the basic plan is more popular among mature adults.This suggests that the price points for plans do not correlate with age. Therefore, we can tailor marketing strategies to highlight the features of the subscription plans that appeal to different age groups.

Netflix can be accessed through 4 different device types: Smart TVs, laptops, smartphones, and tablets. I grouped Smart TVs and laptops as desktops. Smartphones and tablets as mobile devices.Q2: Laptops and tablets are the most popular devices for streaming. To capitalize on this, we can optimize the user experience for these two device types since they generate the most revenue. Additionally, we can develop features and promotions specifically for laptops and tablets to further expand its user base.

I predicted that mature adults would primarily access Netflix through Smart TVs, which is accurate. However, smartphones are most popular with mid adults rather than young adults.Q3: Despite this, I believe there is a correlation between device types and age. By leveraging this demographic and subscription data, we can create targeted marketing campaigns, such as promoting family plans to households and mobile-specific offers to younger users.

Q4: The subscription price points range from $10 - $15. Although the Premium subscription has the highest price point, users with Base subscriptions generate the most monthly revenue. We can enhance marketing efforts to promote the basic plan to increase its revenue.
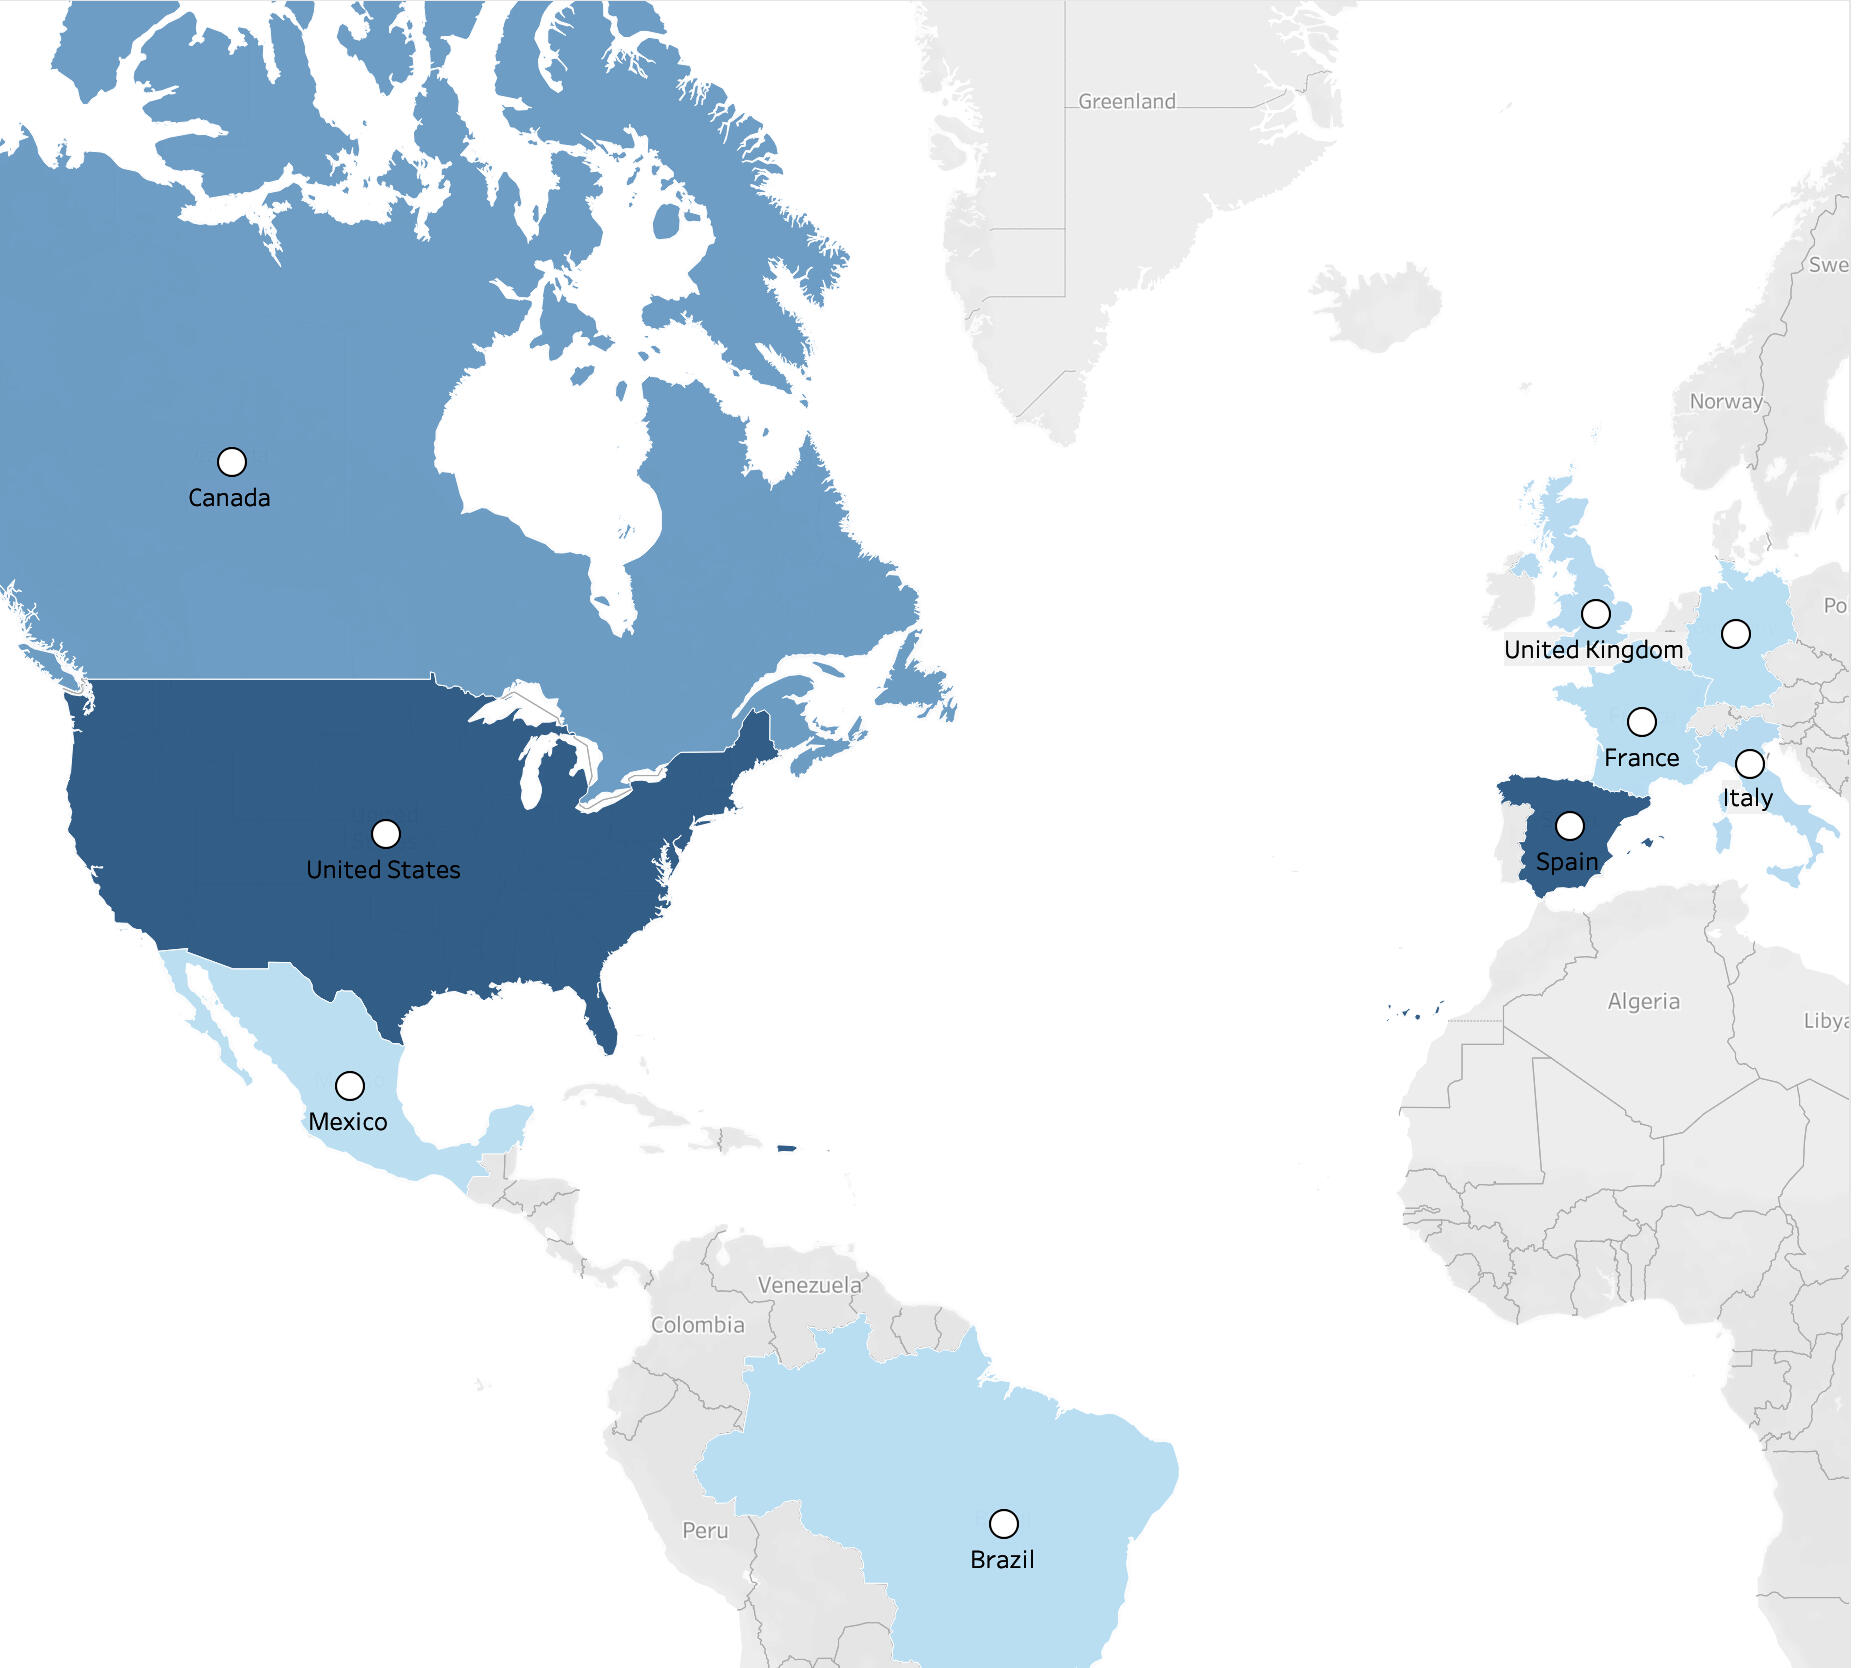

Q5: The United States generates the most revenue, followed by the United Kingdom and then Canada. To increase the user base, we can intensify marketing efforts in these countries. Additionally, I categorized users based on their world regions and found that most users are located in Europe. This suggests that although North America has fewer users, it remains highly profitable.